- Per capita electricity consumption is the single most telling proxy for a country's stage of economic development — and for which products and business models can realistically succeed there.
- Africa's median is 324 kWh per person per year — roughly equivalent to running three light bulbs and one washing machine. Half of African nations fall below this level.
- The gap between generation and consumption is not a sign of surplus. It reflects transmission losses, industrial capture and unreliable supply — each a material business risk.
- Four distinct market stages exist — from basic electrification to near-universal access, each with a different investment thesis and a different set of viable business models.
- Electricity is a filter, not just a utility — matching your business to the right power environment is one of the highest-leverage decisions you will make when entering Africa.
Choosing the right African market is not primarily a question of GDP, population size or trade relationships. It is a question of infrastructure — and the single most revealing piece of infrastructure data available is per capita electricity consumption. Get this number right for a country, and a great deal else follows.
This piece builds a simple but powerful framework. We take one underused metric — kilowatt-hours consumed per person per year — and use it to map African countries into four distinct development stages, each with its own investable thesis and its own set of viable business models. We then explain why the gap between a country's power generation and what actually reaches consumers is itself a critical risk factor that any serious investor or operator needs to understand before committing capital.
Before diving into country comparisons, we need a human-scale reference point. Consider two ordinary household items: a 60-watt light bulb used four hours each evening, and a 380-watt washing machine run twice a week. Together they consume roughly 130 kWh per person per year — a useful floor for thinking about what electricity actually means to the people who use it.
Africa's Median: 324 kWh Per Person Per Year
When African countries are ranked by per capita electricity consumption, the figure at the midpoint is 324 kWh per person per year — roughly two and a half of those basic household "packages." For a family of four, that translates to a shared annual allowance of around 1,300 kWh, with no meaningful room for air conditioning, a refrigerator running through the night, or any industrial-grade equipment.
"Around half of African countries consume less than 324 kWh per person per year. At that level, electrification is still about keeping the lights on — not powering an economy."
Now compare that figure against three global benchmarks:
- United States — 12,968 kWh/year, roughly 40× the African median
- China — 6,112 kWh/year, roughly 19× the African median
- India — 1,085 kWh/year, roughly 3× the African median
India is often cited as a developing-market comparison for Africa. Yet India's per capita consumption is more than three times the African median. The gap is not a rounding error — it reflects a fundamentally different baseline for what an economy can support.
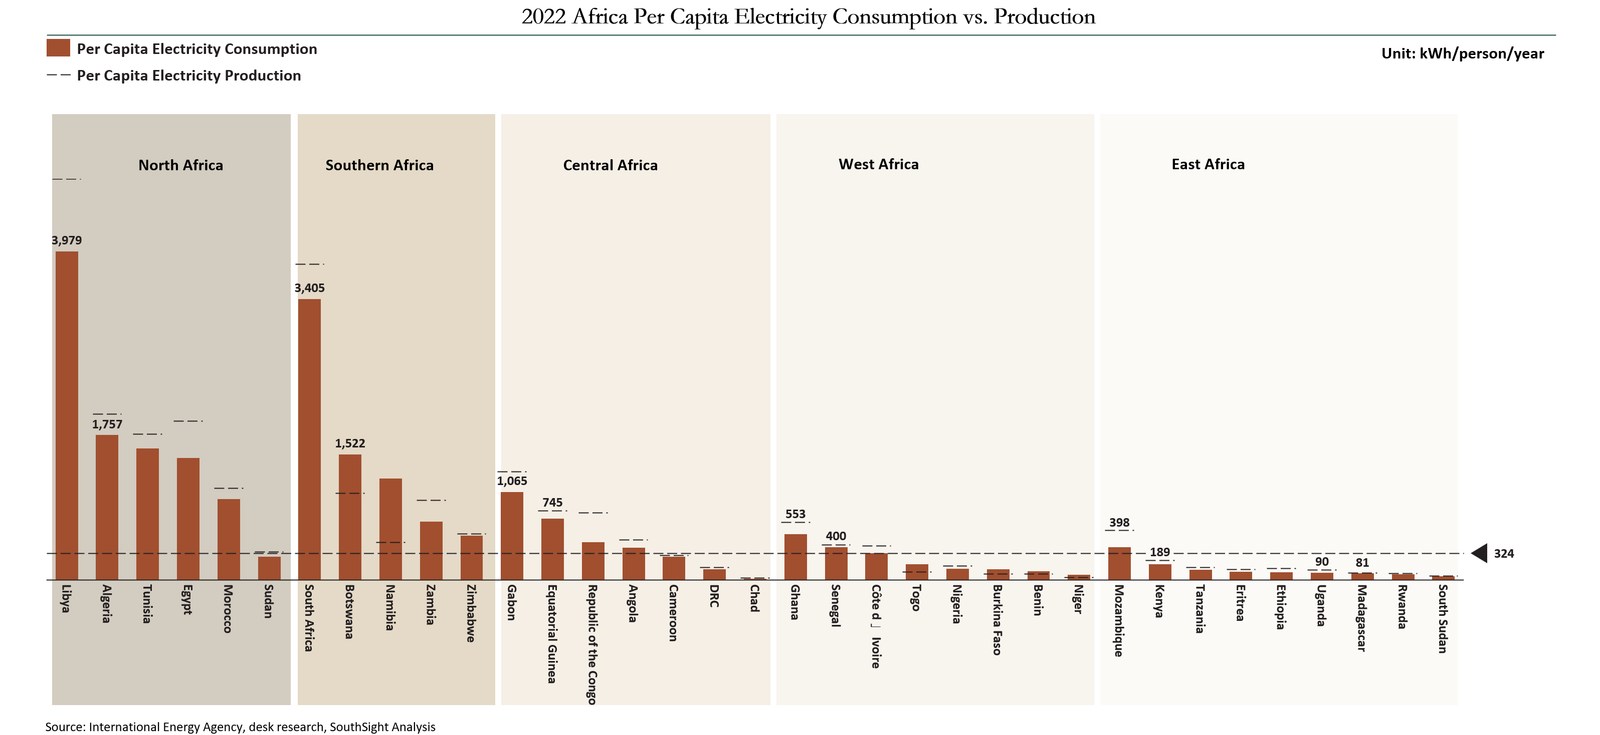
Looked at by sub-region, the leaders stand out clearly:
- North Africa — broadly strong consumers (excluding Sudan)
- Southern Africa — South Africa stands decisively ahead
- Central Africa — Gabon, Equatorial Guinea and Angola are above average, mostly on resource wealth
- West Africa — Ghana and Senegal lead; most others remain far behind
- East Africa — Mozambique is the only country above the median
Why Generation Numbers Can Mislead You
A natural question arises: many African countries generate substantially more electricity per capita than they consume. If there is surplus generation, why do businesses still run diesel generators and households still face rolling blackouts?
This gap is one of the most important due diligence insights for any investor entering Africa. It breaks down into three distinct risk factors.
Risk Factor 1: A large share of power never arrives
For every unit of electricity generated in some African countries, as little as 65–70% reaches an end user safely and reliably. Ageing infrastructure, grid instability, and non-technical losses (including theft) compound the problem. The generation figure on a country datasheet is the optimistic number.
Transmission and distribution losses are universal — no grid is lossless. The global average is around 10%. In Sub-Saharan Africa, multiple studies put the figure at 18–23%, with some countries significantly higher. Nigeria's losses have been measured above 35% in certain periods; Kenya's range from 16–23%.
Risk Factor 2: Much of the power that does arrive was never meant for you
A significant share of electricity in resource-rich African countries is consumed by a handful of large industrial offtakers — aluminium smelters, copper mines, ore-processing facilities. A single such plant can match the residential consumption of an entire mid-sized city.
Some capacity is built explicitly for export. Mozambique's Cahora Bassa hydropower plant historically sends more than 60% of its output to South Africa. That electricity appears in Mozambique's generation statistics but has no bearing on whether a factory in Maputo can rely on the grid.
"The lived experience for a resident or small business in these countries: there is a large power station somewhere; the lights still go out at night."
Risk Factor 3: Rated capacity is not dependable capacity
Generation statistics often reflect installed capacity and theoretical output — not what you can actually count on, day to day. Ageing plants go offline for want of maintenance budgets or fuel. Hydro-dependent systems see sharp swings during drought years. State utilities carrying heavy debt manage costs through scheduled load-shedding.
The practical result: a country whose datasheet looks reasonably powered, but whose business community treats a diesel backup generator as a standard capital line item. If you see high per-capita generation alongside low per-capita consumption in the data, do not read that as latent opportunity. Read it as a warning to investigate further.
Once you add a second variable — the electrification rate (the share of the population with basic electricity access) — the picture sharpens considerably. Plotting these two metrics together produces a framework that is both analytically rigorous and directly actionable.
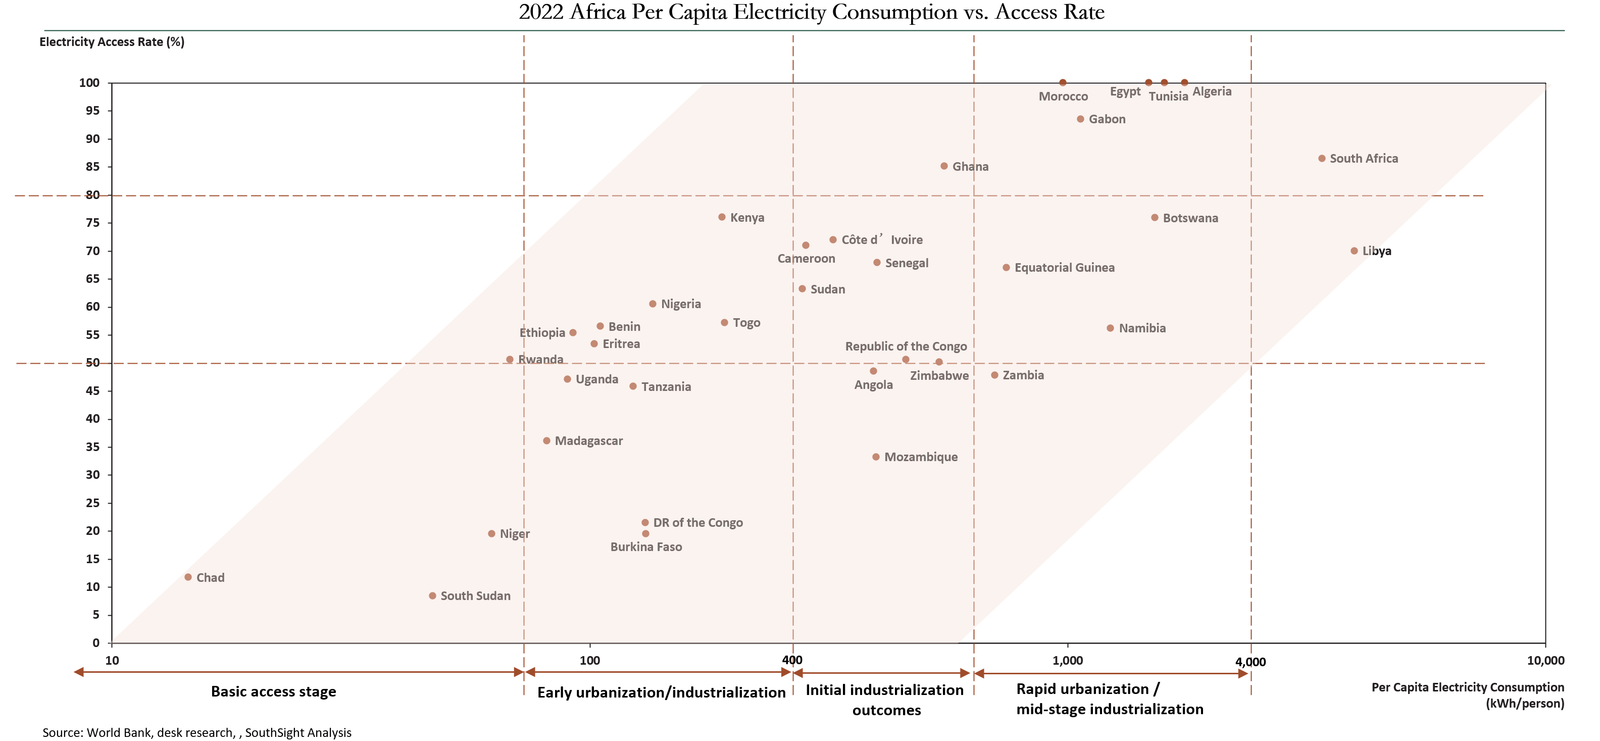
Two threshold lines divide the electrification axis: 50% (where major cities are online but large rural areas remain dark) and 80% (near-universal access, where the binding constraint shifts from "do people have electricity?" to "how much do they have?"). On the consumption axis, reference lines at 100, 400, 1,000 and 4,000 kWh mark meaningful transitions in what an economy can sustain.
Together, these create four investor-relevant market stages.
| Stage | Per Capita kWh & Electrification | Example Countries | Business Models That Fit |
|---|---|---|---|
| Stage 1 — Basic Access | <100 kWh; <50% electrified | Chad, Niger, South Sudan | Off-grid solar, storage, pay-as-you-go models |
| Stage 2 — Early Growth | 100–400 kWh; ~50% electrified | Kenya, Tanzania, Senegal, Uganda | Consumer goods, light manufacturing, e-commerce, mobile finance |
| Stage 3 — Initial Industrialisation | 400–1,000 kWh; 60–80% electrified | Ghana, Zambia, Côte d'Ivoire | Manufacturing, cold chain, B2B services, retail |
| Stage 4 — Industrialised | 1,000+ kWh; >80% electrified | Egypt, Morocco, South Africa | Complex supply chains, high-value consumer, tech |
Stage 1 — Basic Access: The Off-Grid Opportunity
Countries in Stage 1 (Chad, Niger, South Sudan and others) have per capita consumption below 100 kWh and electrification rates typically under 50%. Power is limited to minimal lighting, mobile phone charging and a handful of communal facilities. Many households share access with a neighbour, a school or a church.
The grid-centric business models that work in Stage 3 and Stage 4 countries are simply not viable here. What is viable — and increasingly attractive — is the off-grid economy: solar home systems on pay-as-you-go contracts, small-scale battery storage, last-mile distribution networks, and the mobile financial infrastructure that supports them. These are not consolation-prize markets. They represent the ground floor of an energy transition that will take decades to play out.
"The question to ask at Stage 1 is not 'where is the grid?' but 'how do people pay for the energy they already use, and what would they buy if they had a reliable source?'"
Stage 2 — Early Growth: Africa's Highest-Velocity Window
Countries between 100 and 400 kWh per capita — Kenya, Tanzania, Uganda, Senegal and several others — are undergoing the most dynamic economic transformation on the continent. Major cities have stable grid access. Households are beginning to acquire televisions, electric fans and small refrigerators. Light manufacturing and processing industries are emerging.
This is the stage where the consumer upgrade cycle begins. The transition from "only lighting" to "household appliances" is happening right now in these markets, and it corresponds precisely to the window when brand loyalty is established, distribution networks are built, and first-mover advantages compound. For consumer goods manufacturers, logistics operators and e-commerce platforms, Stage 2 countries are the highest-priority target.
The important caveat: infrastructure within these countries is uneven. Urban centres operate at Stage 3 conditions; peri-urban and rural areas operate at Stage 1. A city-focused entry strategy can sidestep most of the infrastructure risk.
Stage 3 — Initial Industrialisation: The Manufacturing Threshold
Stage 3 countries — Ghana, Zambia, Côte d'Ivoire, Botswana — have per capita consumption between 400 and 1,000 kWh and electrification rates of 60–80%. Household appliance penetration has risen noticeably. Industrial loads are meaningful. Cities have visible night-time illumination.
These markets have crossed the threshold at which manufacturing relocation becomes viable. A factory can realistically operate here — though grid reliability and electricity pricing will determine whether industrial economics stack up. For investors evaluating manufacturing footprints, Stage 3 countries warrant serious diligence: the power infrastructure exists, but the quality and cost of that power vary significantly within and between countries.
Cold-chain logistics, B2B services and modern retail formats are also increasingly viable in Stage 3 — provided operators are selective about location and build in power resilience from day one.
Stage 4 — Industrialised Markets: The Established Tier
North African countries (Egypt, Morocco, Tunisia, Algeria, Libya) and South Africa sit in Stage 4: per capita consumption above 1,000 kWh, electrification rates above 80%. Power reaches virtually the entire population, outage frequency has declined materially, and the demand structure is diverse — heavy industry, services and digital economy activities coexist.
In electricity terms, these markets have already crossed into quasi-middle-income territory. They can support complex supply chains, higher-value consumer goods, and technology investment.
The trade-off: competition is also more intense, market access is more regulated, and the low-hanging first-mover fruit has often been picked. Stage 4 markets reward execution quality over market-entry timing.
Electricity data is not just an analytical curiosity. It should drive five concrete decisions for any company serious about Africa.
1. Choose your target market by power profile, not just by size
A large population is not a large market if the infrastructure cannot support your product. Before ranking countries by GDP or consumer numbers, filter by power stage. A home appliance brand entering a Stage 1 country is not just facing a hard sell — it is facing a market that physically cannot support sustained use of its product.
Run the filter in reverse too: if your product or service has a low electricity requirement — basic consumer goods, mobile-first services, solar equipment — the most power-constrained markets may offer the largest unmet demand and the least competition.
2. Treat the generation-consumption gap as a due diligence red flag
When a country's per-capita generation substantially exceeds its per-capita consumption, ask three questions before assuming surplus capacity:
- Where do the transmission losses actually sit, and what is the realistic delivered-power figure?
- What share of generation is committed to industrial offtakers or export contracts?
- What is the state utility's financial position, and how does it manage peak demand?
The answers will tell you more about operating risk than any top-line energy statistic.
3. Use industrial parks and SEZs to de-risk power dependency
Even in countries with unreliable national grids, industrial parks and special economic zones typically maintain dedicated, more stable power supply — often from ring-fenced generation assets or direct utility contracts. For any business with material power requirements, entering through an established industrial park is not just a convenience; it is a risk management strategy.
Several African governments have invested significantly in these zones precisely to attract foreign manufacturing and services investment. The power reliability within them often exceeds what the national statistics would suggest.
4. Build power resilience into your cost model from day one
In Stage 2 and Stage 3 markets especially, treating grid power as a dependable input is optimistic planning. The more resilient approach — and increasingly the standard among experienced operators — is to pair operations with on-site solar generation and battery storage from the outset.
This is no longer expensive or experimental. Solar-plus-storage costs have fallen dramatically, and the technology is well-suited to African conditions. Operators who build it in from day one avoid the retrofit cost and operational disruption that comes from discovering the grid is unreliable after the fact.
5. Track the trajectory, not just the current stage
Countries move between stages. Ethiopia, Rwanda and Côte d'Ivoire have all seen meaningful electrification progress over the past decade. The most attractive entry timing is often when a country is visibly transitioning — electrification rates climbing through 40–60%, grid investments underway, urban demand accelerating — rather than after the transition is complete and the obvious opportunities are gone.
Per capita electricity data, tracked annually, is one of the cleanest early signals of that transition. Build it into your market-monitoring framework.
"Electricity is a threshold and a compass. It tells you what a market can support today and where it is heading tomorrow. The investors and operators who learn to read it will consistently find themselves in the right place at the right time."